Get Ready To Buy Back AUD/USD Dips Towards 0.9280 - Westpac

Early this month, Westpac projected that AUD/USD rebound was set for further gains towards 0.9510 (AUD was trading sub 0.91 at the time). Now as the pair has already reached this target over the past few days before retracing around one and half big figure lower, Westpac is out with another call on AUD. "Since then consensus has clearly shifted on China and the A$ has moved sharply higher. However, I am not convinced that this improvement in Asia is fully 'in the price'. This week's flash PMI in China is a good example. Markets were expecting a modest improvement, but got a solid rise to 6 ...

Asian Stocks Fall Third Day, Trimming Monthly Advance

Asian stocks fell for a third day, trimming the biggest monthly advance on the regional benchmark index since January 2012, as industrial and health care companies retreated. Nitto Denko Corp. (6988) slumped 11 percent as BNP Paribas SA advised selling shares of the materials manufacturer, saying the surge since the announcement of its inclusion in the Nikkei 225 Stock Average was overdone. Primary Health Care Ltd. (PRY) sank 1.6 percent in Sydney after a board member sold 340,000 shares of the provider of health-care services. Advantest Corp. retreated 7.2 percent after the semiconductor maker forecast a

The 3 Big Lies Right Now

There appears to be 3 big lies (among many other smaller ones) currently driving the flow of speculative capital around the world. First, Bernanke said the Taper was off due to 'worsening' financial conditions (except financial conditions remain very near all-time highs). Many mean-reverting extrapolators are calling for a renaissance in emerging markets and Asian growth that will lead us out of this 'temporary' slowdown (except consensus growth expectations for Asian economies are tumbling in reality) and most people assume US economic 'escape velocity' growth is around the corner and the Fed will

Yen collapses on corporate tax cut talk

The Japanese Yen is weakening across the board following headlines from Kyodo news, saying "Japan stimulus steps to have pledge to study corporate tax cut", referring to cuts in corporate tax rate. The headline is not sitting well for those long Japanese Yen, with heavy buying interest emerging immediately afterwards, as the Nikkei 225 in Japan also recovers the bid tone to now be flat from a 1.3% down. Earlier on the day, LDP’s Noda said PM Abe is due to announce economic measures, including the VAT, corporate tax and other stimulatory measures, on October 1. Looking at key levels, the

US Dollar Chart Setup Warns Selloff May Be Set to Resume

US DOLLAR TECHNICAL ANALYSIS – Prices put in a Bearish Engulfing candlestick pattern below rising trend line support-turned-resistance set from early April (now at 10587), hinting a move lower is ahead. Near-term support is at 10469, the June 13 low, with a push beneath that exposing the March 25 bottom at 10413. Alternatively, a reversal above the trend line targets the August 16 low at 10646.
Forex_US_Dollar_Chart_Setup_Warns_Selloff_May_Be_Set_to_Resume_body_Picture_5.png, US Dollar Chart Setup Warns Selloff May Be Set to Resume
Daily Chart - Created Using FXCM Marketscope 2.0
** The Dow Jones FXCM US Dollar Index and the Mirror Trader USD basket are not the same product.
S&P 500 TECHNICAL ANALYSIS – Prices are pulling back as expected, completing a bearish Evening Star candlestick pattern and breaking below the 23.6% Fibonacci expansionat 1708.70. Sellers are now testing the 38.2% level at 1693.00, with a push beneath that exposing the 50% Fib at 1680.30. The 1708.70 mark has been recast as near-term resistance.
Forex_US_Dollar_Chart_Setup_Warns_Selloff_May_Be_Set_to_Resume_body_Picture_6.png, US Dollar Chart Setup Warns Selloff May Be Set to Resume
Daily Chart - Created Using FXCM Marketscope 2.0
GOLD TECHNICAL ANALYSIS  Prices found interim support at 1320.86, the 38.2% Fibonacci expansion, edging higher to set their sights on resistance in the 1341.60-47.52 area. This is defined by a horizontal pivot and the 23.6% Fib. A break above the outer threshold of this region targets rising channel support-turned-resistance at 1393.15. Alternatively, a reversal through support eyes the 50% expansion at 1304.10.
Forex_US_Dollar_Chart_Setup_Warns_Selloff_May_Be_Set_to_Resume_body_Picture_7.png, US Dollar Chart Setup Warns Selloff May Be Set to Resume
Daily Chart - Created Using FXCM Marketscope 2.0
CRUDE OIL TECHNICAL ANALYSIS Prices broke support at the bottom of a rising channel set from early July and an upward-sloping trend line established from mid-April. Sellers are now testing the 38.2% Fibonacci retracement at 102.05, with a break below that eyeing the 50% mark at 98.91.Channel support-turned-resistance is now at 105.15.
Forex_US_Dollar_Chart_Setup_Warns_Selloff_May_Be_Set_to_Resume_body_Picture_8.png, US Dollar Chart Setup Warns Selloff May Be Set to Resume

AUD/USD – Continues to Drift Lower below 0.94

The AUD/USD has enjoyed a solid run over the last few weeks which has been punctuated by a strong surge higher last week sending it to a three month high just above 0.95. In the last week or so it has slowly drifted back a little lower and is now consolidating just below 0.94 which has established itself as a key level over the last week. Several weeks ago the AUD/USD had been trying valiantly to stay above the support level at 0.89 as all week it placed downward pressure but was unable to sustain any break lower. At the beginning of August it moved very well from three year lows to move back above the key level of 90 cents and beyond to a two week high just above 0.92 to finish out that week. Over the last month or so, it has certainly shown some signs of continuing lower and moving through the 0.8850 to 0.9000 range but has recovered well lately. At the end of July the AUD/USD fell very strongly and appeared to resume the medium term down trend as it moved to a new three year low near 0.8850 but it reversed very well and looked poised to continue back towards the longer term resistance level at 0.93 before its obstacle at 0.9250. This level emerged again a couple of weeks ago as a level of significance although it has now been cleared.
Throughout July the AUD/USD placed constant pressure on the 0.93 level again as it continued to place buying pressure on that level however the resistance there was able to stand firm. It was during this time it did very well to maintain its price level well above 0.92 as place upward buying pressure on the resistance level at 0.93. Over the course of the last couple of months the 0.93 level has provided reasonable resistance to any movement higher and now that this level has been broken, it is providing a measure of support. Throughout July, the AUD/USD spent most of its time trading between 0.90 and 0.93 threatening to break through either level at multiple stages. The 0.9150 level also became a key level during that time providing both some resistance and more recently support, and this was called upon again a few weeks ago providing some much needed support however it was completely ignored a couple of weeks ago as the AUD/USD fell heavily through it.
It was only a month or so ago that many were waiting for the AUD/USD to break below the 90 cents level and then it would have been a matter of how far can it drop. It had continued to drift lower and move towards the 90 cents level, a level not seen for three years. Considering the speed of its decline over the last few months, the last couple of months has seen a significant slowing down and almost some consolidation as it has rested well on the support at 0.90 and made its way back to 0.93 on a few occasions. The last few months have seen the AUD/USD establish a strong medium term down trend with lower peaks and lower troughs, as it has moved from near 1.06 down to near 0.90 in that time. Up until mid April, the Australian dollar was enjoying its best move higher since October and November last year. After making a solid run higher in the middle of June back towards the key level of 0.97, the AUD/USD has since continued its strong and steady decline moving to below 0.90 and levels not seen since near the middle of 2010.
On Wednesday, the RBA issued its biannual financial stability review. There was nothing dramatic in the report, as the RBA noted that Australian banks are in solid shape. The RBA reiterated a call to the country’s banks to maintain loan standards in the face of record-low interest rates, which have led to an increase in credit demand. Earlier in the week Chinese Flash Manufacturing PMI showed improvement. The key index continues to point to expansion, improving from 50.1 points in July to 51.2 points in August. This beat the estimate of 50.9 points. Key Chinese releases, such as PMIs, can have a major impact on the Australian dollar, since China is Australia’s number one trading partner.
(Daily chart / 4 hourly chart below)
AUDUSD Technical Analysis Daily Chart

AUDUSD Technical Analysis Candlestick 4 Hour Chart
AUD/USD September 25 at 23:40 GMT   0.9365   H: 0.9388   L: 0.9338 AUD/USD Technical
S3S2S1R1R2R3
0.89000.88500.94000.9500

During the early hours of the Asian trading session on Thursday, the AUD/USD is consolidating in a narrow range between 0.9360 and 0.9370, after having recently eased back from near 0.9390.   Despite its slowing and slight recovery the last couple of months, the Australian dollar has been in a free-fall, as the currency lost around 15 cents since the beginning of May. In moving through to 1.0580 only a few months ago, it moved to its highest level since January. Current range: trading just above 0.9360.
Further levels in both directions:
• Below: 0.8900 and 0.8850
• Above: 0.9400 and 0.9500.

OANDA’s Open Position Ratios

(Shows the ratio of long vs. short positions held for the AUD/USD among all OANDA clients. The left percentage (blue) shows long positions; the right percentage (orange) shows short positions.)
The long position ratio for the AUD/USD has moved back above 60% as the Australian dollar has eases back below 0.94. The trader sentiment remains in favour of long positions.

US Fiscal D-Day Has A Yen Longing

Capital markets should be about to change gears. Last weeks disappointing ‘no’ taper certainly has the Fed losing some of its street ‘cred.’ This week, the markets are mostly in neutral, sometimes swayed by the erratic messaging from various Fed heads on display. However, the markets foot is on the clutch, ready to shift into a higher gear and again engage any fallout from the US government, opposition and lawmaker’s lack of cohesive agreement over the debt ceiling and US budget – sadly, not unfamiliar territory.
An equally long-drawn-out Washington budget battle two years ago led to the unprecedented downgrading of the US government debt, sending shivers down the spine of global Capital Markets. US Fiscal cliff concerns are again on many investors’ radar as its now highly probably that an agreement will not be reached by next weeks October 1st deadline. Last week, Fed Chair Bernanke alluded to policy makers concerns with Washington, the current political impasse is a good enough reason why not to start the QE tapering process. 
Investors are beginning to question how much tapering is actually being priced in for October or December. The apparent event risk is the Fed not tapering at all this year. Obviously those odds will only get shorter with an ongoing budget battle in Washington. The possible suspension or delay of US economic releases, like this months employment report, will only make it more difficult for dealers and investors’ alike to interpret data to predict future events. The budget and debt ceiling standoff will quickly become the key driver for market uncertainty and volatility.
Pricing has subtly begun – US Treasuries and German bunds yields have fallen below the lows of last weeks FOMC meet announcement. Even the shorten end of the curve, money market instruments have removed most of the steepening priced in to taper. If anything, markets are pricing in things to get worse and a Fed taper to be further delayed – more lower yields. 
The dollar is trying to edge higher against the so-called riskier or commonwealth currencies (NZD, AUD, CAD and GBP). The USD will be strongly favored if US lawmakers fail to arrange a budget deal preventing a US government shut down. The historically go to safer haven currencies – the yen and the Swiss franc – are preparing to stand fast against the dollar as market attentions becomes more influenced by the lack of action or break through on the US budget front. 
The somewhat nonchalant approach is beginning to irk higher command. US Treasury Secretary Lew says Wall Street should take the looming debt limit more seriously. One has to look at equity indexes trading at -2% below their all-time highs reached last week and conclude that this is not a market wholly worried about the current on going shenanigans in Washington. Believing that everything will be “OK on the night” is not the most prudent of trading strategies – even the VIX is indicating calm markets. 
The lethargic market needs help, it will turn its attention to this morning’s US durable orders print and new home sales for some guidance. The durables release is expected to show another decline for a second consecutive month in August, held down by the usual suspect – aircraft. The ex-transportation orders could be the surprise component, bouncing back after falling in July. Market consensus has new US home sales rallying between +6% and 8% last month, albeit good, it would only be a partial reverse of July’s -13% decline. Released results like this do not help investors, if anything it will increase market uncertainty with regards to the Fed’s policy intentions. Add in a little underrated Washington political discord, and capital markets will be having a negative impact on risk appetite.
Investors who had expected better things of the dollar on a change in US monetary policy now have to question their current strategies. USD/JPY (¥98.50) trading since the FOMC meet has all been about yen crosses and risk on/off again. Excluding the immediate purge of the dollar longs following the Fed’s ‘no’ taper surprise, yen has been sold mostly for carry positioning. Prudently, the market should be expecting the ‘mighty’ dollar to face pronounced selling pressure against the yen as investors begin to wake up to the fact that a budget impasse could lead to a shutdown of parts of the US economy. Dollar rallies should look like an enticing sell – however, there are many still to convince. The bulk of the current market remains short yen and is willing to add dollars, mostly via dollar buy stop losses. We should expect that “the wake up call” realization will lead to a nervous left hand side for USD/JPY.
Forex heatmap
Other Links:
Fed Speeches Support The EUR
Dean Popplewell, Director of Currency Analysis and Research @ OANDA MarketPulseFX
This article is for general information purposes only. It is not investment advice or a solution to buy or sell securities. Opinions are the authors; not necessarily that of OANDA Corporation or any of its affiliates, subsidiaries, officers or directors. Leveraged trading is high risk and not suitable for all. You could lose all of your deposited funds.

Bank of England Watching Rising House Prices

The Bank of England will keep a close eye on the rising cost of houses in the country and says it can choose from a range of policy tools to employ if a price surge posed a risk to the financial system.
A number of recent housing indexes have suggested that prices are approaching pre-crisis highs, with London showing a particular resurgence. Nationwide confirmed in August that an average home was now worth £170,825 ($260,098), the highest since June 2008 when the average was £172,415. Meanwhile, property website Rightmove has predicted that prices are set to increase by 6 percent this year, from an initial estimate of 2 percent at the start of the year.
The figures have given rise to fears that a housing bubble is brewing.

US Treasury Secretary Warns Republicans Government Cash Will Run Out October 17

Treasury Secretary Jack Lew said Republicans aren’t working fast enough to extend the debt limit—and the consequences of inaction are dire.
“If you look at the calm out there, which I think is a bit greater than it should be, there’s a sense that 2011 was a terrible experience and nobody would do that again,” Lew said Tuesday at the Bloomberg Markets 50 conference in New York. “People have to take seriously the fact that Congress has a lot of work to do in a short period of time and the consequences of their failure are very substantial.”
Lew also said the U.S. is almost out of money, and said in a letter to Congress Wednesday that Oct. 17 is the likely deadline when “extraordinary measures” will run out.
“It will be the middle of October when we are left with just cash–no more ability to go out and borrow unless Congress acts,” Lew said at the conference.

Superyacht makers at Monaco Yacht Show buoyant as demand grows

Monaco Yacht Show
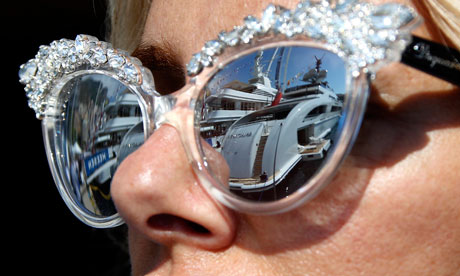
Superyacht makers are in an upbeat mood, with 69% rating prospects for the year ahead as 'good or excellent'. Photograph: Eric Gaillard/Reuters
Ed Miliband's assertion that the rising tide of economic fortune used to lift all boats, but now only seems to lift yachts, would certainly seem to be borne out by the Monaco Yacht Show. The show, which has just begun, boasts Europe's largest collection of superyachts. At the show the Labour leader would find that demand is once again surging for the ultimate billionaire's plaything, ranging from an entry-level 30 metre-long boat costing around £10m, to gigantic vessels with 90-strong crews that are effectively private cruise liners.
The UK superyacht industry – a superyacht is more than 24 metres long – has reported record revenues of £460m, up 4% on last year, as more of their traditional customers in the US, Russia and the Middle East place orders for these custom-built, floating palaces.
In a survey of 138 companies in the superyacht industry, half reported an increased workload compared to a year ago, while only 19% – a smaller proportion than last year – said their workload had gone down.
The companies, which include yacht builders, designers and legal firms, are also in their most upbeat mood since before the economic crash, with 69% rating their prospects for the year ahead as "good or excellent", compared with 51% last year.
Tom Chant of Superyacht UK said the industry was in a buoyant mood, but profits had not yet returned to the 2007 pre-recession era.
"That was a particular bubble that has definitely burst." Current growth was more stable, he said. "The people who are coming into the market do have the money, they are not borrowing on banks who have borrowed on other things. The buyers that are coming in are good solid buyers who are there for the long-term."
The UK industry, which employs 3,550 people, has further room to grow. "There are more yards that could build yachts, than there are yachts with orders," Chant added.
The revival is supported by another industry survey from yachtmaker Camper & Nicholsons, which reported a 37% jump in yacht sales in the first half of the year to around 200 boats. However, the overall value of the market remained flat at $1bn (£620m), as industry figures are easily skewed by a few hyper-extravagant purchases.
The biggest market for superyachts remains the US, followed by Russia and the Middle East. China's super-rich have yet to develop much of an interest, despite the recent sale of Sunseeker International to the country's Dalian Wanda group. In Monaco "there is lots of talk about the potential of China, but it is just potential," said Chant.
The downturn slowed yacht buyers' appetite for extra-large yachts, with demand for vessels greater than 50 metres falling in 2011 and 2012, according to Camper & Nicholsons. But there are signs that it may be returning.
On the drawing board of the Hampshire-based firm Dubois are plans for a giant sloop, 101 metres long with a 125-metre mast that would dwarf both Big Ben's Elizabeth Tower and the Statue of Liberty.

Forex Volatility Tumbles Post-FOMC, Major USD Losses Unlikely

US Dollar tumbles post-Federal Open Market Committee decision
- Forex volatility prices likewise fell sharply, limiting potential for Dollar losses
- Our strategy trading preferences favor recent winners
Forex volatility prices have fallen sharply and suggest that major FX
pairs may stick to tight trading ranges through the foreseeable future.
The US Federal Open Market Committee (FOMC) sent the US Dollar sharply lower, but the simultaneous tumble in our DailyFX Volatility Indices suggests that further declines are less likely.
Forex Volatility Prices Tumble Following the Highly-Anticipated FOMC Decision
Forex_Volatility_Prices_tumble_-_US_Dollar_Losses_Less_Likely_body_Picture_1.png, Forex Volatility Tumbles Post-FOMC, Major USD Losses Unlikely
Source: OTC FX Options Prices from Bloomberg; DailyFX Calculations
In fact, our 1-Week, 1-Month, and 3-Month Volatility Indices show that traders predict some of the slowest forex market conditions since January. A strongly positive correlation between volatility and the Dow Jones FXCM Dollar Index suggests the Greenback can continue near significant lows.
Our trend-following Momentum2 trading strategy has done well selling into US Dollar weakness and remains our preferred system until further notice. Yet we’ll stress that past performance is not indicative of future results. This fact seems particularly relevant now: our sentiment-based trading systems tend to do better in high-volatility market conditions.
Our preference indeed remains towards what’s worked well to date, but it looks like a good time to trade on lower leverage in anticipation of potential underperformance in our trend-following strategies.
Sign up for e-mail updates via my distribution list for any changes to our biases.
DailyFX Individual Currency Pair Conditions and Trading Strategy Bias
Forex_Volatility_Prices_tumble_-_US_Dollar_Losses_Less_Likely_body_Picture_2.png, Forex Volatility Tumbles Post-FOMC, Major USD Losses UnlikelyForex_Volatility_Prices_tumble_-_US_Dollar_Losses_Less_Likely_body_Picture_3.png, Forex Volatility Tumbles Post-FOMC, Major USD Losses Unlikely
--- Written by David Rodriguez, Quantitative Strategist for DailyFX.com
To receive the Speculative Sentiment Index and other reports from this author via e-mail, sign up to David’s e-mail distribution list via this link.
Contact David via
Definitions
Volatility Percentile – The higher the number, the more likely we are to see strong movements in price. This number tells us where current implied volatility levels stand in relation to the past 90 days of trading. We have found that implied volatilities tend to remain very high or very low for extended periods of time. As such, it is helpful to know where the current implied volatility level stands in relation to its medium-term range.
Trend – This indicator measures trend intensity by telling us where price stands in relation to its 90 trading-day range. A very low number tells us that price is currently at or near 90-day lows, while a higher number tells us that we are near the highs. A value at or near 50 percent tells us that we are at the middle of the currency pair’s 90-day range.
Range High – 90-day closing high.
Range Low – 90-day closing low.
Last – Current market price.
Bias – Based on the above criteria, we assign the more likely profitable strategy for any given currency pair. A highly volatile currency pair (Volatility Percentile very high) suggests that we should look to use Breakout strategies. More moderate volatility levels and strong Trend values make Momentum trades more attractive, while the lowest Vol Percentile and Trend indicator figures make Range Trading the more attractive strategy.
HYPOTHETICAL PERFORMANCE RESULTS HAVE MANY INHERENT LIMITATIONS, SOME OF WHICH ARE DESCRIBED BELOW. NO REPRESENTATION IS BEING MADE THAT ANY ACCOUNT WILL OR IS LIKELY TO ACHIEVE PROFITS OR LOSSES SIMILAR TO THOSE SHOWN. IN FACT, THERE ARE FREQUENTLY SHARP DIFFERENCES BETWEEN HYPOTHETICAL PERFORMANCE RESULTS AND THE ACTUAL RESULTS SUBSEQUENTLY ACHIEVED BY ANY PARTICULAR TRADING PROGRAM.
ONE OF THE LIMITATIONS OF HYPOTHETICAL PERFORMANCE RESULTS IS THAT THEY ARE GENERALLY PREPARED WITH THE BENEFIT OF HINDSIGHT. IN ADDITION, HYPOTHETICAL TRADING DOES NOT INVOLVE FINANCIAL RISK, AND NO HYPOTHETICAL TRADING RECORD CAN COMPLETELY ACCOUNT FOR THE IMPACT OF FINANCIAL RISK IN ACTUAL TRADING. FOR EXAMPLE, THE ABILITY TO WITHSTAND LOSSES OR TO ADHERE TO A PARTICULAR TRADING PROGRAM IN SPITE OF TRADING LOSSES IS MATERIAL POINTS WHICH CAN ALSO ADVERSELY AFFECT ACTUAL TRADING RESULTS. THERE ARE NUMEROUS OTHER FACTORS RELATED TO THE MARKETS IN GENERAL OR TO THE IMPLEMENTATION.
OF ANY SPECIFIC TRADING PROGRAM WHICH CANNOT BE FULLY ACCOUNTED FOR IN THE PREPARATION OF HYPOTHETICAL PERFORMANCE RESULTS AND ALL OF WHICH CAN ADVERSELY AFFECT ACTUAL TRADING RESULTS. Any opinions, news, research, analyses, prices, or other information contained on this website is provided as general market commentary, and does not constitute investment advice. The FXCM group will not accept liability for any loss or damage, including without limitation to, any loss of profit, which may arise directly or indirectly from use of or reliance contained in the trading signals, or in any accompanying chart analyses.
 
Copyright © 2013 Forex learning | Powered by Blogger.com.