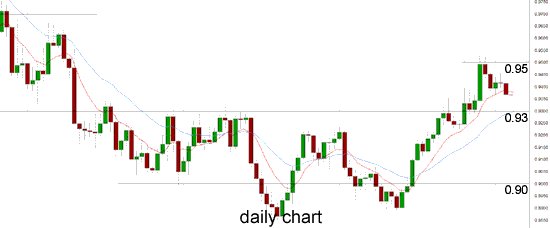
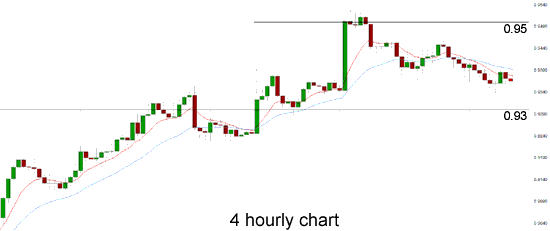
The AUD/USD has enjoyed a solid run over the last few weeks which has been punctuated by a strong surge higher last week sending it to a three month high just above 0.95. In the last week or so it has slowly drifted back a little lower and is now consolidating just below 0.94 which has established itself as a key level over the last week. Several weeks ago the AUD/USD had been trying valiantly to stay above the support level at 0.89 as all week it placed downward pressure but was unable to sustain any break lower. At the beginning of August it moved very well from three year lows to move back above the key level of 90 cents and beyond to a two week high just above 0.92 to finish out that week. Over the last month or so, it has certainly shown some signs of continuing lower and moving through the 0.8850 to 0.9000 range but has recovered well lately. At the end of July the AUD/USD fell very strongly and appeared to resume the medium term down trend as it moved to a new three year low near 0.8850 but it reversed very well and looked poised to continue back towards the longer term resistance level at 0.93 before its obstacle at 0.9250. This level emerged again a couple of weeks ago as a level of significance although it has now been cleared.
Throughout July the AUD/USD placed constant pressure on the 0.93 level again as it continued to place buying pressure on that level however the resistance there was able to stand firm. It was during this time it did very well to maintain its price level well above 0.92 as place upward buying pressure on the resistance level at 0.93. Over the course of the last couple of months the 0.93 level has provided reasonable resistance to any movement higher and now that this level has been broken, it is providing a measure of support. Throughout July, the AUD/USD spent most of its time trading between 0.90 and 0.93 threatening to break through either level at multiple stages. The 0.9150 level also became a key level during that time providing both some resistance and more recently support, and this was called upon again a few weeks ago providing some much needed support however it was completely ignored a couple of weeks ago as the AUD/USD fell heavily through it.
It was only a month or so ago that many were waiting for the AUD/USD to break below the 90 cents level and then it would have been a matter of how far can it drop. It had continued to drift lower and move towards the 90 cents level, a level not seen for three years. Considering the speed of its decline over the last few months, the last couple of months has seen a significant slowing down and almost some consolidation as it has rested well on the support at 0.90 and made its way back to 0.93 on a few occasions. The last few months have seen the AUD/USD establish a strong medium term down trend with lower peaks and lower troughs, as it has moved from near 1.06 down to near 0.90 in that time. Up until mid April, the Australian dollar was enjoying its best move higher since October and November last year. After making a solid run higher in the middle of June back towards the key level of 0.97, the AUD/USD has since continued its strong and steady decline moving to below 0.90 and levels not seen since near the middle of 2010.
On Wednesday, the RBA issued its biannual financial stability review. There was nothing dramatic in the report, as the RBA noted that Australian banks are in solid shape. The RBA reiterated a call to the country’s banks to maintain loan standards in the face of record-low interest rates, which have led to an increase in credit demand. Earlier in the week Chinese Flash Manufacturing PMI showed improvement. The key index continues to point to expansion, improving from 50.1 points in July to 51.2 points in August. This beat the estimate of 50.9 points. Key Chinese releases, such as PMIs, can have a major impact on the Australian dollar, since China is Australia’s number one trading partner.
(Daily chart / 4 hourly chart below)


AUD/USD September 25 at 23:40 GMT 0.9365 H: 0.9388 L: 0.9338 AUD/USD Technical
During the early hours of the Asian trading session on Thursday, the AUD/USD is consolidating in a narrow range between 0.9360 and 0.9370, after having recently eased back from near 0.9390. Despite its slowing and slight recovery the last couple of months, the Australian dollar has been in a free-fall, as the currency lost around 15 cents since the beginning of May. In moving through to 1.0580 only a few months ago, it moved to its highest level since January. Current range: trading just above 0.9360.
Further levels in both directions:
• Below: 0.8900 and 0.8850
• Above: 0.9400 and 0.9500.
OANDA’s Open Position Ratios

(Shows the ratio of long vs. short positions held for the AUD/USD among all OANDA clients. The left percentage (blue) shows long positions; the right percentage (orange) shows short positions.)
The long position ratio for the AUD/USD has moved back above 60% as the Australian dollar has eases back below 0.94. The trader sentiment remains in favour of long positions.
Throughout July the AUD/USD placed constant pressure on the 0.93 level again as it continued to place buying pressure on that level however the resistance there was able to stand firm. It was during this time it did very well to maintain its price level well above 0.92 as place upward buying pressure on the resistance level at 0.93. Over the course of the last couple of months the 0.93 level has provided reasonable resistance to any movement higher and now that this level has been broken, it is providing a measure of support. Throughout July, the AUD/USD spent most of its time trading between 0.90 and 0.93 threatening to break through either level at multiple stages. The 0.9150 level also became a key level during that time providing both some resistance and more recently support, and this was called upon again a few weeks ago providing some much needed support however it was completely ignored a couple of weeks ago as the AUD/USD fell heavily through it.
It was only a month or so ago that many were waiting for the AUD/USD to break below the 90 cents level and then it would have been a matter of how far can it drop. It had continued to drift lower and move towards the 90 cents level, a level not seen for three years. Considering the speed of its decline over the last few months, the last couple of months has seen a significant slowing down and almost some consolidation as it has rested well on the support at 0.90 and made its way back to 0.93 on a few occasions. The last few months have seen the AUD/USD establish a strong medium term down trend with lower peaks and lower troughs, as it has moved from near 1.06 down to near 0.90 in that time. Up until mid April, the Australian dollar was enjoying its best move higher since October and November last year. After making a solid run higher in the middle of June back towards the key level of 0.97, the AUD/USD has since continued its strong and steady decline moving to below 0.90 and levels not seen since near the middle of 2010.
On Wednesday, the RBA issued its biannual financial stability review. There was nothing dramatic in the report, as the RBA noted that Australian banks are in solid shape. The RBA reiterated a call to the country’s banks to maintain loan standards in the face of record-low interest rates, which have led to an increase in credit demand. Earlier in the week Chinese Flash Manufacturing PMI showed improvement. The key index continues to point to expansion, improving from 50.1 points in July to 51.2 points in August. This beat the estimate of 50.9 points. Key Chinese releases, such as PMIs, can have a major impact on the Australian dollar, since China is Australia’s number one trading partner.
(Daily chart / 4 hourly chart below)


| S3 | S2 | S1 | R1 | R2 | R3 |
| 0.8900 | 0.8850 | — | 0.9400 | 0.9500 | — |
During the early hours of the Asian trading session on Thursday, the AUD/USD is consolidating in a narrow range between 0.9360 and 0.9370, after having recently eased back from near 0.9390. Despite its slowing and slight recovery the last couple of months, the Australian dollar has been in a free-fall, as the currency lost around 15 cents since the beginning of May. In moving through to 1.0580 only a few months ago, it moved to its highest level since January. Current range: trading just above 0.9360.
Further levels in both directions:
• Below: 0.8900 and 0.8850
• Above: 0.9400 and 0.9500.
OANDA’s Open Position Ratios
(Shows the ratio of long vs. short positions held for the AUD/USD among all OANDA clients. The left percentage (blue) shows long positions; the right percentage (orange) shows short positions.)
The long position ratio for the AUD/USD has moved back above 60% as the Australian dollar has eases back below 0.94. The trader sentiment remains in favour of long positions.
0 comments:
Post a Comment