US DOLLAR TECHNICAL ANALYSIS – Prices put in a Bearish Engulfing candlestick pattern below rising trend line support-turned-resistance set from early April (now at 10587), hinting a move lower is ahead. Near-term support is at 10469, the June 13 low, with a push beneath that exposing the March 25 bottom at 10413. Alternatively, a reversal above the trend line targets the August 16 low at 10646.
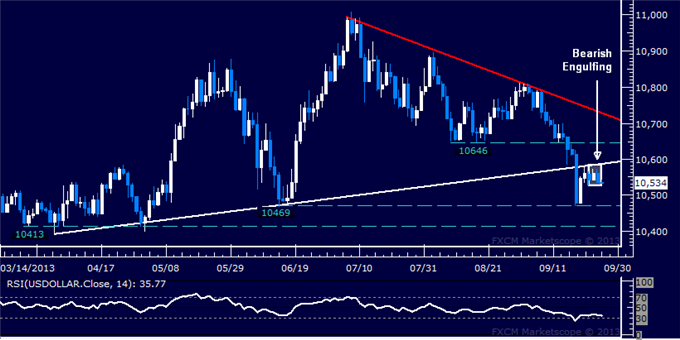
Daily Chart - Created Using FXCM Marketscope 2.0
** The Dow Jones FXCM US Dollar Index and the Mirror Trader USD basket are not the same product.
S&P 500 TECHNICAL ANALYSIS – Prices are pulling back as expected, completing a bearish Evening Star candlestick pattern and breaking below the 23.6% Fibonacci expansionat 1708.70. Sellers are now testing the 38.2% level at 1693.00, with a push beneath that exposing the 50% Fib at 1680.30. The 1708.70 mark has been recast as near-term resistance.
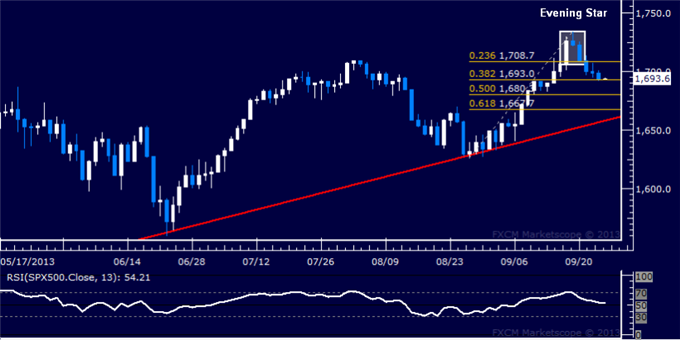
Daily Chart - Created Using FXCM Marketscope 2.0
GOLD TECHNICAL ANALYSIS – Prices found interim support at 1320.86, the 38.2% Fibonacci expansion, edging higher to set their sights on resistance in the 1341.60-47.52 area. This is defined by a horizontal pivot and the 23.6% Fib. A break above the outer threshold of this region targets rising channel support-turned-resistance at 1393.15. Alternatively, a reversal through support eyes the 50% expansion at 1304.10.
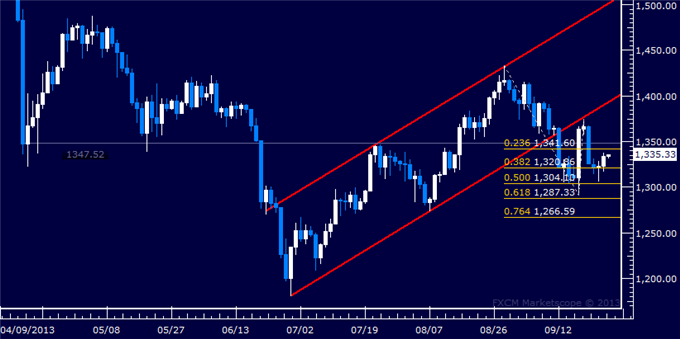
Daily Chart - Created Using FXCM Marketscope 2.0
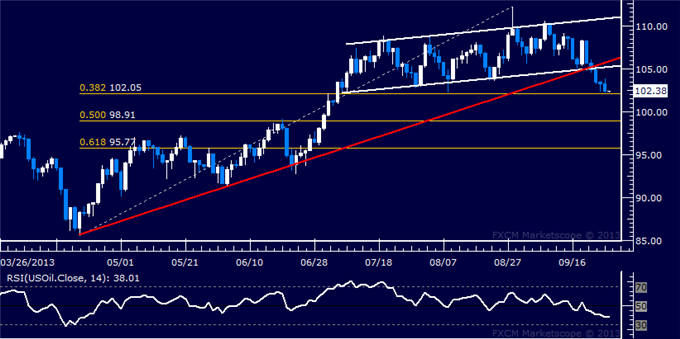
CRUDE OIL TECHNICAL ANALYSIS– Prices broke support at the bottom of a rising channel set from early July and an upward-sloping trend line established from mid-April. Sellers are now testing the 38.2% Fibonacci retracement at 102.05, with a break below that eyeing the 50% mark at 98.91.Channel support-turned-resistance is now at 105.15.
0 comments:
Post a Comment